Larger factories, more cars, more exhaust fumes – air pollution is increasing worldwide. In some cities of the world, the air is already so polluted that it is absolutely unsuitable for breathing.
We have evaluated tens of thousands of weather stations worldwide and examined the air quality in numerous cities. The results of the investigation are worrying. In many parts of the world, air pollution is so severe that it kills thousands of people every year. India is particularly badly affected.
Cities in India have the worst air in the world
The city with the worst air quality in the world is called Gurugram, a suburb of the mega-metropolis New Delhi in India. With around 877,000 inhabitants, Gurugram is not one of the largest cities in the country, but when it comes to air pollution, Gurugram is unbeaten in first place in the world.
With an average pollution level of 135.8 in 2018, the city’s air is definitely considered unhealthy. For several months of the past year, the air was even classified as “very unhealthy”.
The main cause of this unhealthy air is fine dust, also known as PM2.5. This occurs in large numbers in India, including through the daily burning of plastic, which is used for heating.
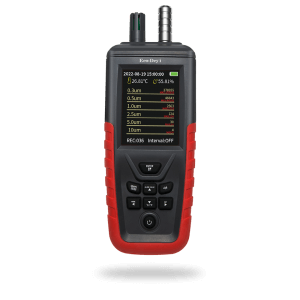
Related: PM2.5 detectors let you monitor the air quality in real time.
Smog in the air costs human lives
What is particularly striking in our study is that almost all of the cities in the top 50 most polluted places in the world are located in India, Pakistan and China .
The metropolises of these countries are often the manufacturing sites for countless products exported to the world market. Huge chimneys blow exhaust fumes into the surrounding area, and there is often a lack of awareness of environmental protection.
According to our study, air pollution kills around seven million people every year. We want to make people think about the air we breathe, because when we understand the impact of air quality on our lives, we will take action to protect what matters most.
Air Quality Index: Global overview of current air pollution
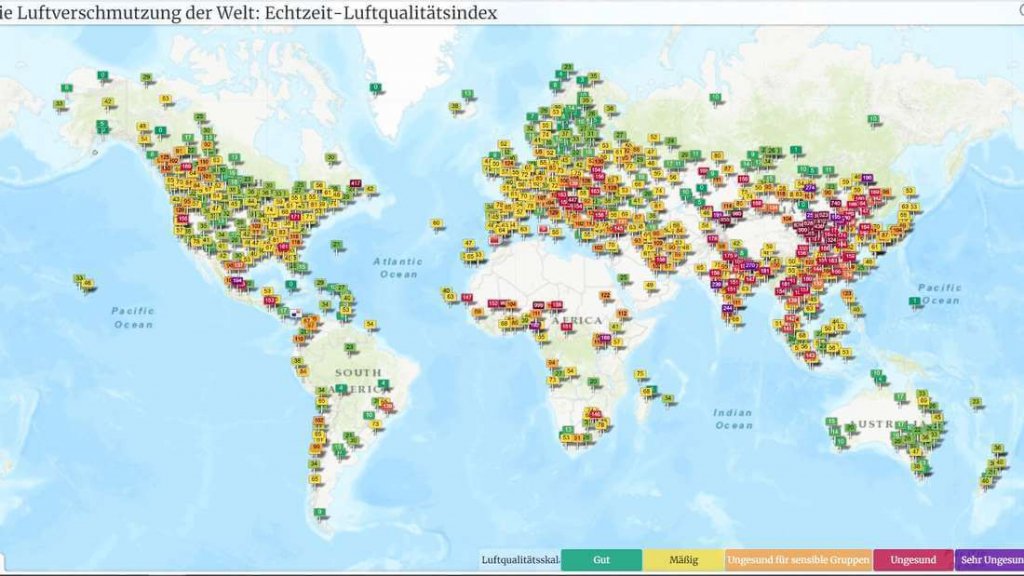
After opening the online air quality index map, users can zoom in on any region of the world by holding down the CTRL key and scrolling with the mouse wheel. Alternatively, a search function can also be used to search for specific locations worldwide. Once the desired location or a specific region has been found, colored signs indicate the local air quality.
| Index color | Air quality level | Index value | Air quality description |
| Green | Good | 0 to 50 | good air quality, air pollution carries little or no risk |
| Yellow | Moderate | 51 to 100 | acceptable air quality, moderate risk for people sensitive to air pollution |
| Orange | Unhealthy for Sensitive Groups | 101 to 150 | unhealthy for sensitive groups but not for the general public |
| Red | Unhealthy | 151 to 200 | unhealthy air, possible health effects for all people, serious risk for sensitive people |
| Purple | Very unhealthy | 201 to 300 | very unhealthy air for entire population |
| Dark Red | Hazardous | 301 and above | dangerous air with health warning |

